No-Vig Fair Value: Stripping the Bookmaker’s Cut From NBA Prop Lines
 Available in US
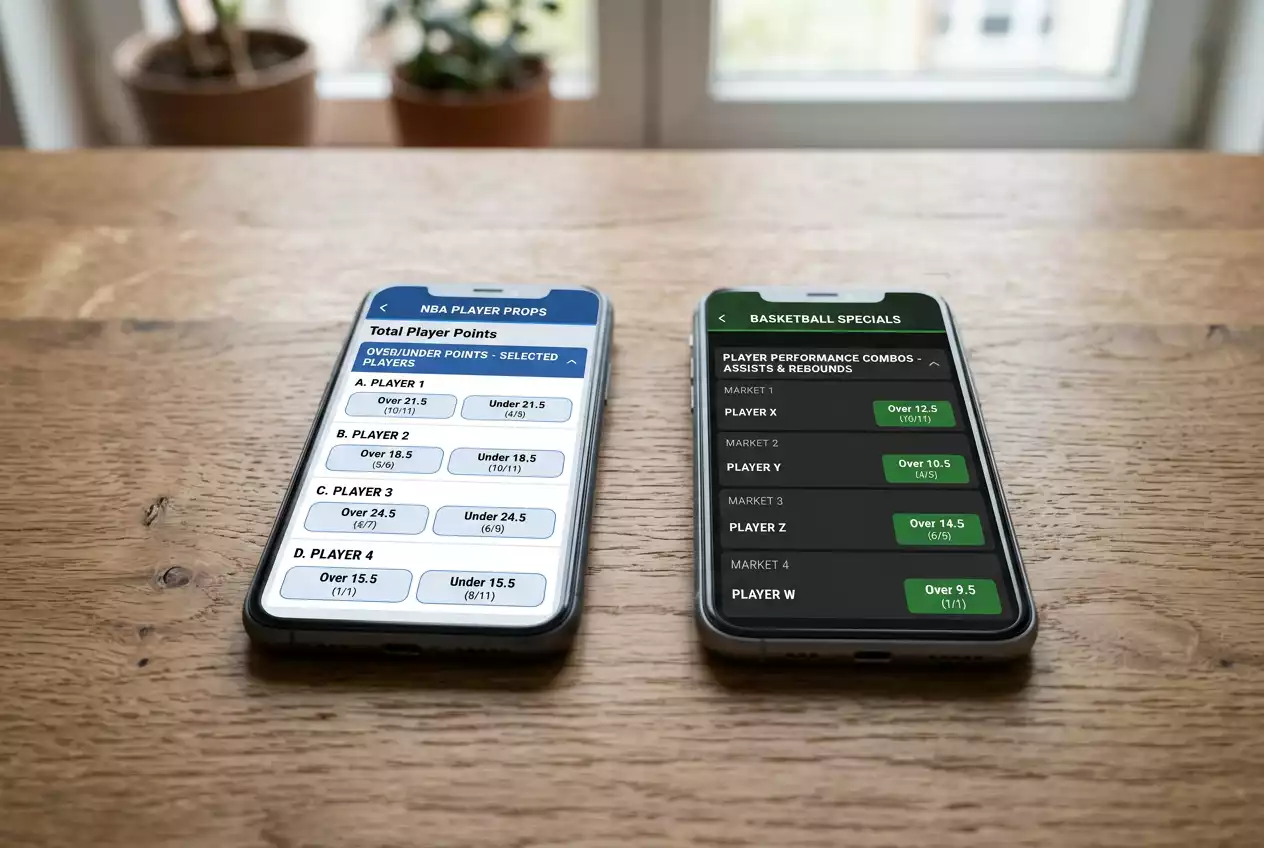
Every Quoted Line Already Has the House Edge Inside It
The first time someone showed me how to back out the no-vig price on a prop line, my immediate reaction was a kind of mild embarrassment. I had been betting NBA props for years and had spent that whole time looking at quoted prices as though they meant what they said. They did not. Every line on a sportsbook menu has a house edge baked into it, and the no-vig calculation is just the simple bit of arithmetic that lets you see what the line would say if the book were not making any money on it.
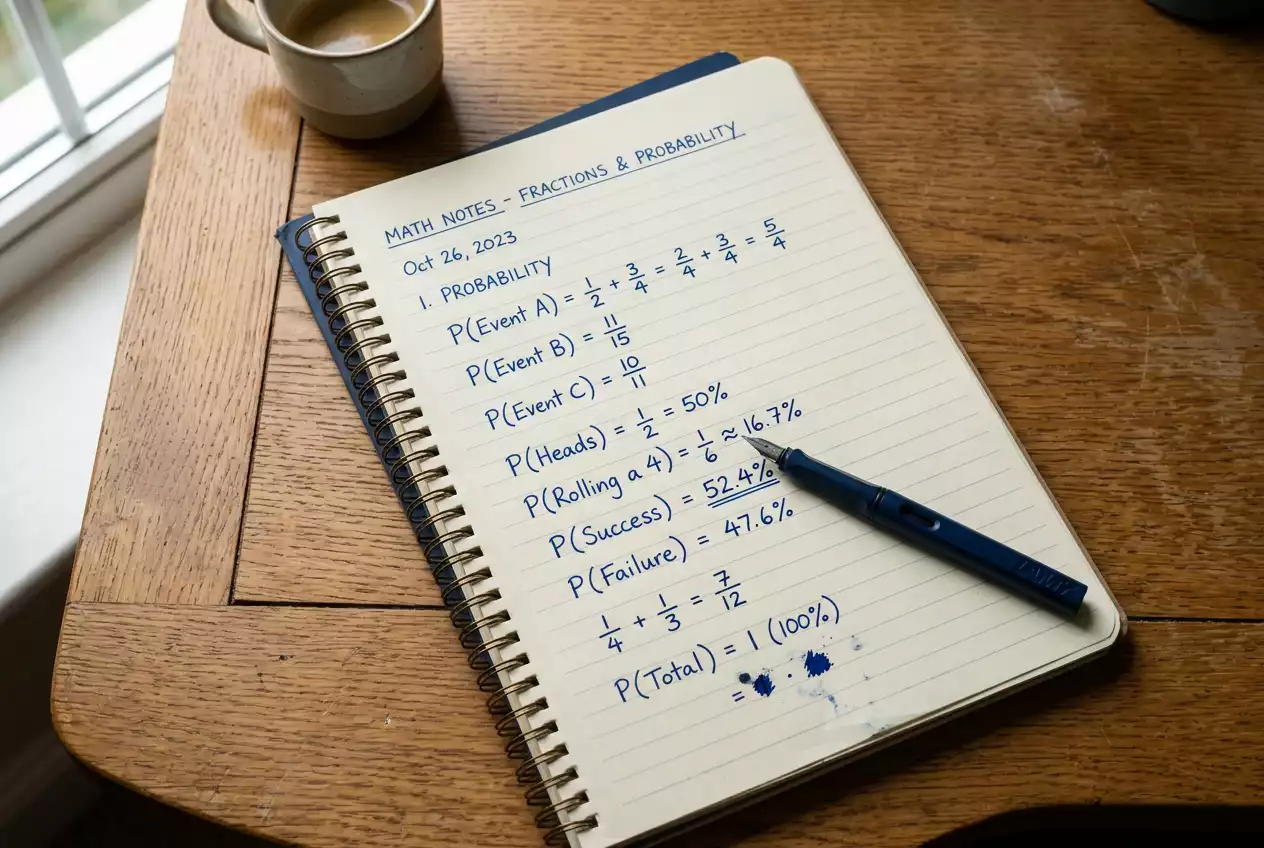
The break-even maths underneath this is unforgiving. At standard prop odds of -110 — decimal 1.91 — a bettor needs a true win probability of 52.4% just to break even before any expected return materialises. Anything less than that loses over time. The no-vig calculation is the tool that tells you whether the implied probability of the line is genuinely above your model’s estimate or whether it just looks that way because the vig is hiding the truth.
This piece walks through what vig is, where it hides, and a three-step formula for stripping it out, with a worked NBA points-prop example at the end.
What Vig Is and Where It Hides
Vigorish — vig, juice, hold, take — is the bookmaker’s commission. It is built into every line by setting the odds on both sides of a market slightly below their fair-probability equivalent. A perfectly fair coin flip would be priced at decimal 2.00 on both sides, with no profit margin for the book. A real two-way market is more typically priced at 1.91 on both sides, which gives the book a guaranteed margin no matter which side wins.
The vig number itself is straightforward to calculate. Convert each side of the market to its implied probability — the reciprocal of the decimal odds — and add the two together. A fair market sums to exactly 100%. A 1.91/1.91 market sums to about 104.7%, and the 4.7% overround is the book’s expected hold on equally distributed action. On a typical NBA player prop, the overround sits in a range from 4% to 8% depending on the market and the operator.
The hiding-place for vig is in plain sight, but bettors miss it because the implied probability of a single side of the market looks plausible. A line at 1.91 has an implied probability of 52.4%, which sounds like a fair representation of “slightly more likely than not”. It is not. The 52.4% is inflated by the share of the overround the book has assigned to that side. The true fair-value probability is what falls out when you strip the overround back out.
The economic logic is the same one that applies to every other commission-based market in the world. Stockbrokers, currency exchanges, ticket resellers — all of them quote prices that include a margin. The no-vig calculation is the financial equivalent of asking what the price would be if the spread were zero.
The No-Vig Formula in Three Steps
The formula has three steps. None of them are difficult, and you can run all three in a spreadsheet faster than you can place the bet.
Step one is converting the quoted odds to implied probabilities. For decimal odds, divide 1 by the decimal price. A line at 1.91 produces an implied probability of 1 / 1.91, which equals 0.5236, or 52.4%. For American odds, the formula differs slightly between negative and positive prices — for a -110 line, divide 110 by (110 + 100), which gives 0.524. The decimal route is faster because UK books quote decimal odds natively and the conversion is one division per side.
Step two is summing the implied probabilities of both sides of the market and dividing each by that sum. If both sides are 1.91, both implied probabilities are 0.524, the sum is 1.048, and dividing 0.524 by 1.048 gives 0.500 on each side. That is the fair-value probability — the probability the book is implicitly assigning to each side once the overround is stripped out. In an evenly priced market like 1.91/1.91, the fair-value probability comes out to exactly 50%, which makes sense intuitively.
Step three is converting the fair-value probability back to fair-value odds. Take the reciprocal: 1 divided by the fair probability gives the fair decimal odds. A 50% fair probability corresponds to fair decimal odds of 2.00 — exactly what a fair coin flip would price at. For an asymmetric market, the maths still holds. If a line is priced at 1.83 on the favourite and 2.05 on the underdog, the implied probabilities are 0.546 and 0.488, summing to 1.034. Dividing each by the sum gives 0.528 and 0.472 — fair probabilities. The reciprocals give fair decimal odds of 1.89 and 2.12, which is what the market would have looked like with the vig stripped out.
The whole calculation takes about thirty seconds for a single market and can be set up in a spreadsheet that does it instantly across every prop you are watching.
A Worked Example on a Points Prop
Let me run a real-feeling example. Say a UK book is offering a points prop on a star player set at 27.5 points, with the over priced at 1.91 and the under priced at 1.91. Both sides at decimal 1.91. This is the most common shape for a points prop on a UK menu — symmetric pricing on both sides of the line.
Step one: implied probabilities. 1 divided by 1.91 equals 0.5236 on each side. Both sides are 52.4%.
Step two: divide by the sum. The sum of the two implied probabilities is 0.5236 plus 0.5236, which equals 1.0472 — the overround is 4.72%. Each side divided by that sum gives 0.5236 / 1.0472, which equals exactly 0.500. The fair probability of each side, with vig stripped out, is 50.0%.
Step three: convert back to odds. The reciprocal of 0.500 is 2.00. The fair-value decimal odds on each side are 2.00. That is what the market would price at if the book made no margin.
Now apply this to a decision. If your model — your projection of how this player tends to perform against this opponent in this venue — gives you a true probability of 54% on the over hitting, your model is saying you have a 4-percentage-point edge over the fair-value probability. The no-vig calculation has confirmed that 4-point edge is real and not just an artefact of how the line was quoted. At quoted odds of 1.91, that edge translates to an expected ROI of roughly 3.1% per stake — small but positive.
Now consider the alternative. If your model says the over has a 53% true probability, your edge is only 3 points over the fair-value 50%. The no-vig calculation has just confirmed your edge is genuinely smaller than it looks at quoted prices. You are still positive, but the margin is thin enough that any error in your projection eats it. The no-vig has not made your projection wrong; it has just made the size of your edge honest.
Turning Fair Value Into a Yes/No Bet Decision
The decision rule that turns no-vig into actionable bets is the simplest part of the whole exercise. You compare your model’s true probability against the fair-value probability that fell out of the calculation. If your true probability is higher, the bet is positive expected value. If it is lower, the bet is negative expected value. If they are equal, the bet is exactly even-money in fair-value terms — not worth placing because the quoted odds still have the vig on them.
The harder question is how much edge is enough. A 1-point edge over fair-value probability at 1.91 odds produces an ROI of less than 1% per stake. After the friction of any account-management constraint, the bankroll variance, the cognitive load of finding and placing the bet, that 1% is not worth the time. Most disciplined prop bettors I know set a personal threshold somewhere between 2% and 4% true edge over fair-value before they bet. The exact number depends on confidence in the underlying model — the more uncertainty in your projection, the wider your required margin needs to be. The broader prop betting maths and tools framework covers the bankroll-sizing and edge-threshold question in more depth.
The other practical filter is volume. A 3% edge bet you find once a week is not the same as a 3% edge bet you can place every night. The first is a hobby; the second is a process. Most bettors are not at the second level and never will be, which is fine — the goal of running no-vig is not to find a treasure trove of edge but to stop losing money on bets that looked like edge before the calculation revealed they were not.
Is the no-vig method reliable on lopsided two-way markets?
It is mathematically reliable but practically more sensitive on lopsided markets. When one side has implied probability above 75%, small errors in the fair-value probability translate to larger errors in fair-value odds because the relationship is non-linear at the extremes. The method still works on lopsided lines, but you need to be more confident in your underlying model and treat the resulting fair value as approximate rather than precise.
How small is too small for a no-vig edge to be worth a bet?
Most disciplined prop bettors require at least a 2-3% true probability edge over the fair-value probability before placing a bet, and many require more. Below 2%, the friction costs and projection uncertainty typically eat the edge. Above 4%, the bet is worth taking seriously even on a smaller stake. The exact threshold depends on confidence in your model and your willingness to absorb variance.
Honest Numbers Beat Confident Picks
The no-vig calculation is the most useful piece of arithmetic in the prop bettor’s toolkit because it is the simplest. There is no model to build, no parameter to tune, no judgment to second-guess. There is just the basic question of what the market would say if the book were not making any money on it. That number — the fair-value probability — is the floor your own model has to clear before any bet you place is genuinely positive expected value. The bettors I trust most are not the ones with the strongest opinions on a given prop. They are the ones who run the no-vig calculation first and only argue about the rest of the model second.
Published by the nba Props Betting team.